Offshore Wind Power Output
Block Island Wind Farm
Power Generation, 2017-2021
Source: EIA.gov
Click here for high-resolution.
Note: During July and August 2021, the Block Island Wind Farm was operating at an average capacity of only 6.6%.

Summer OSW Electrical Supply Risk (2016)
Click here for high-resolution image.
Click here for data & docs.
On 32 days (from May to Aug 2016), an
offshore wind farm could not deliver 94% of the power needed to meet demand. Average power generation accounted for a mere 5.6% of needed electrical demand.
During May to August 2016, there would have been a shortfall of 60% of total capacity from a wind farm.
%20NOAA%20Buoy%20440-0003.jpg/:/cr=t:0%25,l:0%25,w:100%25,h:100%25/rs=w:1023,cg:true)
Expected Daily Power Output -
South Fork Wind Farm
In May, June, and July of 2016, the offshore wind farm would have not generating any power for 20-24% of the time. The wind farm would have been generating at less than 5% cpacity for 52 days, and generating less than 10% cpacity for 102 days.
Click here for high-resolution image.
Wind data provided by the US National Oceanic and Atmospheric Adminis

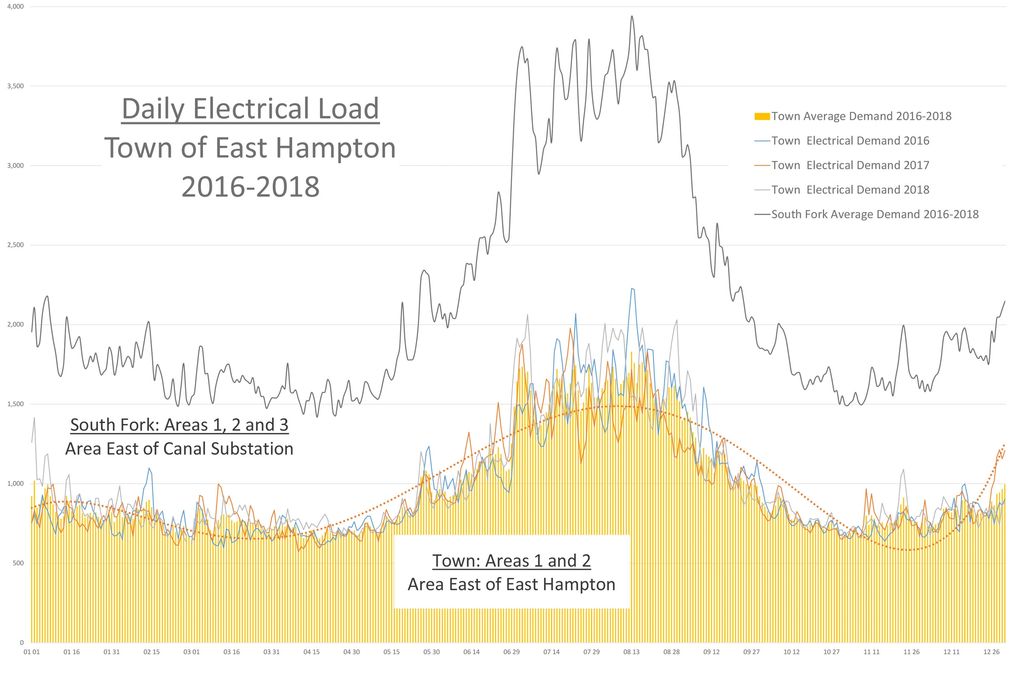
Daily Electrical Demand in the
Town of East Hampton and on the
South Fork of Eastern Long Island
(2016-2018)
-0001.jpg/:/cr=t:0%25,l:0%25,w:100%25,h:100%25/rs=w:1023,cg:true)
Electrical Demand on the South Fork 2018
Wind speed off the US coastline (northeast) in summer is generally weaker than in winter. Therefore, an offshore wind farm generates less power during summer.
The graph (left) shows a high demand for power on the South Fork during summer (in gold), but a low expected power output from an offshore wind farm (132 MW).
(4).jpg/:/cr=t:0%25,l:0%25,w:100%25,h:100%25/rs=w:1023,cg:true)
When wind speed is less than 8 mph, an offshore wind farm generates no power
(example uses GE Haliade-X).
An offshore wind turbine only generate power at full capacity when wind speed exceeds 27 mph (Haliade-X).
When weed speed approach 63 mph, wind turbines shuts down to avoid damage and generates no power (Haliade-X ).
Copyright © 2021 oswSouthFork.info - All Rights Reserved - Legal documents are public | Disclaimer
-0001.jpg/:/cr=t:0%25,l:0%25,w:100%25,h:100%25/rs=w:1023,cg:true)